CloudCADI, a flagship product of Amadis is a one suite FinOps solution for all your cloud cost optimization needs. Follow the steps and start leveraging your cloud environment. In case of any queries contact our support team.
Table of Contents
Onboarding Requirements (Azure Active Directory)
Below details are needed for the onboarding process.
Service Principal: To provide authentication to the created App Service and to provide permission to read data from Log analytics
Log Analytics Workspace: To configure and read data from Log Analytics, to setup Window and Linux counters
Step 1: Service Principal (Azure Active Directory)
This section provides details about the options that need to be configured to enable Single Sign-On (SSO) for the App Service. It also covers the permissions required for reading data from Log Analytics.
Login to Azure Portal and Open Azure Active Directory.
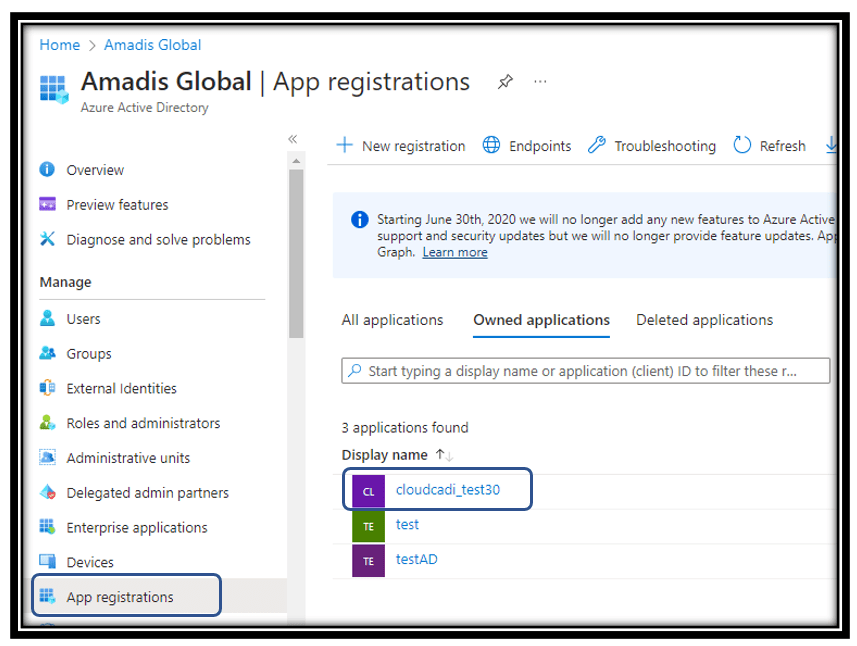
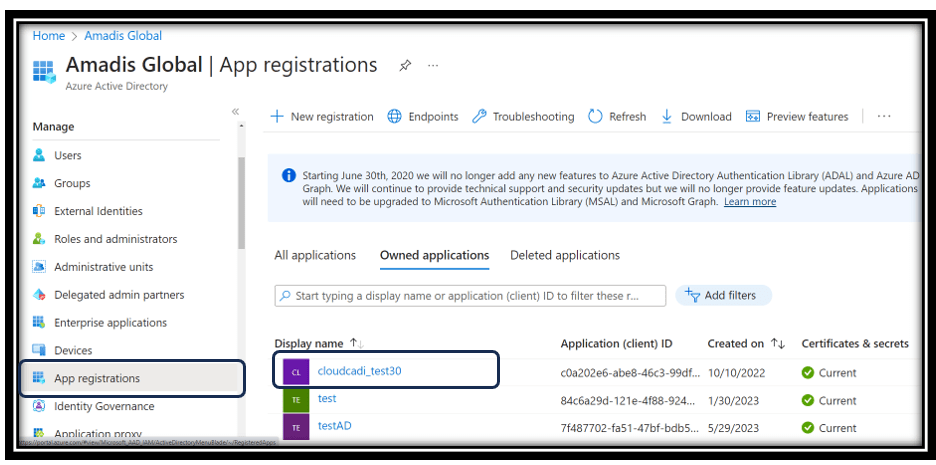
Click on “App Registration”
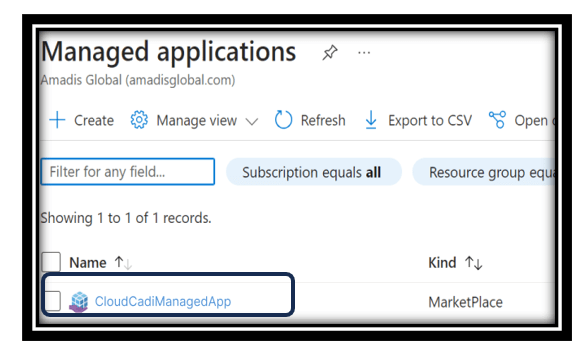
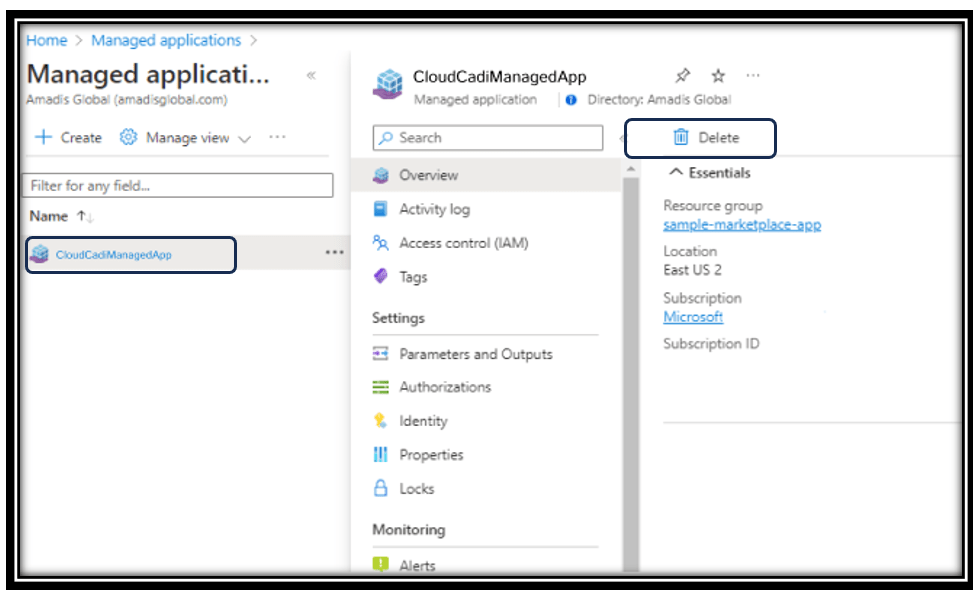
Select the “Service Principal” chosen during the Managed App creation.
Fig 1: App Registration
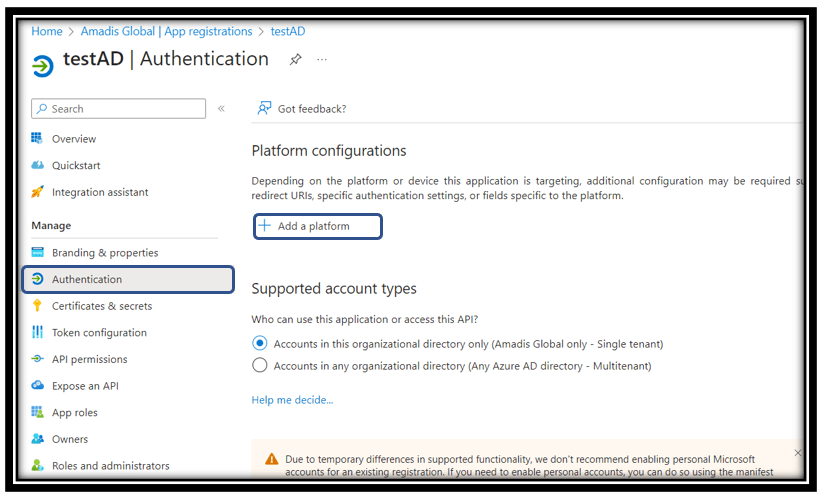
Fig 2: Adding authentication URL
Step 1.1: App Service Authentication
From the Managed Section, Click on the “Authentication” Tab
In the right panel click on the “Add a Platform”
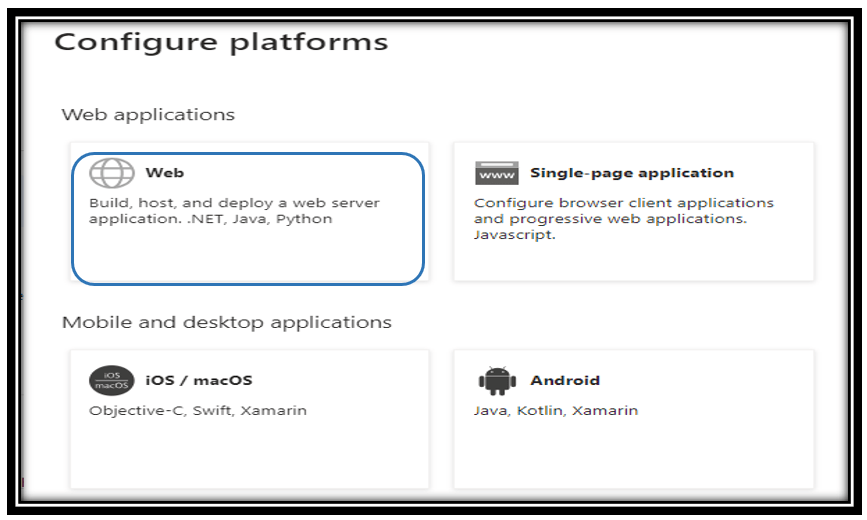
Fig 3: Selecting Web
Step 1.1.1: Configure Platforms
Select Web from the Popup window.
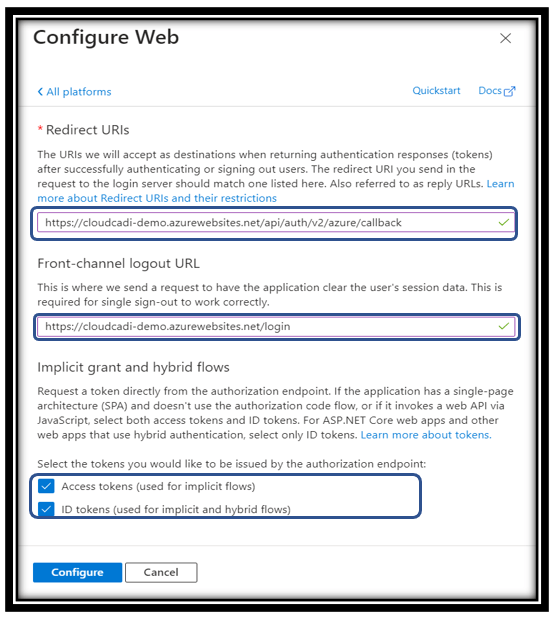
Step 1.1.2: Configure Web
Enter Redirect URI: https://<App service URL>/api/auth/v2/azure/callback
Enter Front-channel logout URL: https:// <App service URL>/login.
In the Implicit grant and hybrid flow, enable Access tokens and Id tokens
Click ‘Configure’ Button.
Fig 4: Configure Web
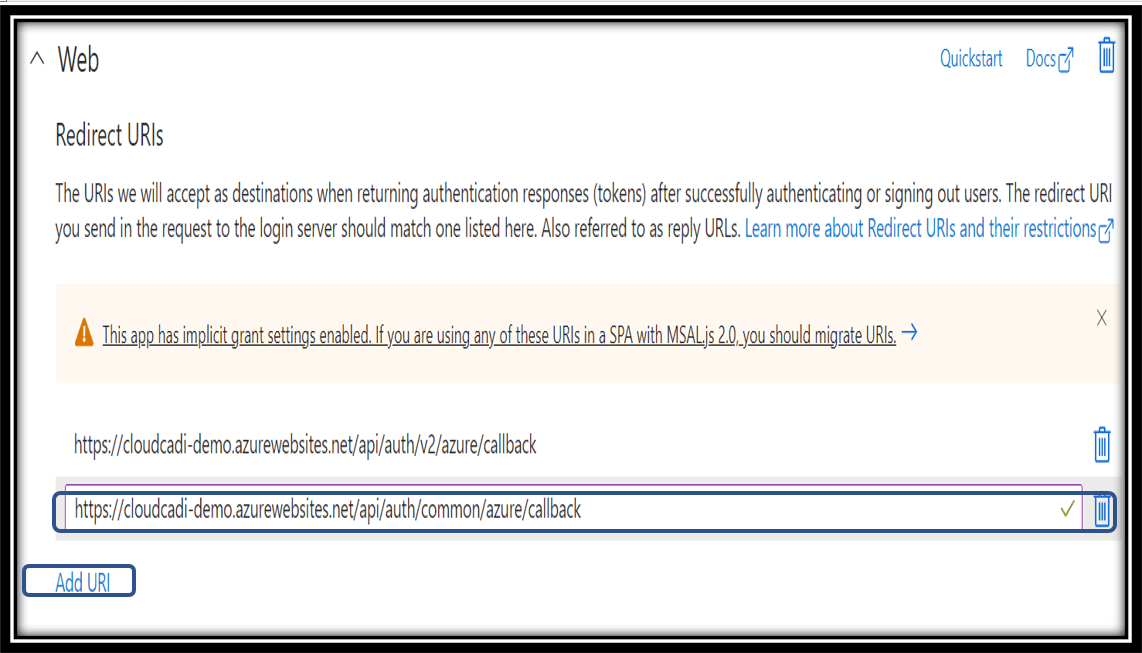
Fig 5: Redirect URI
Step 1.1.3: Redirect URI
Click ADD URI
Enter new Redirect URIs in the format – https:// <App Service URL>/api/auth/common/azure/callback
Click Save
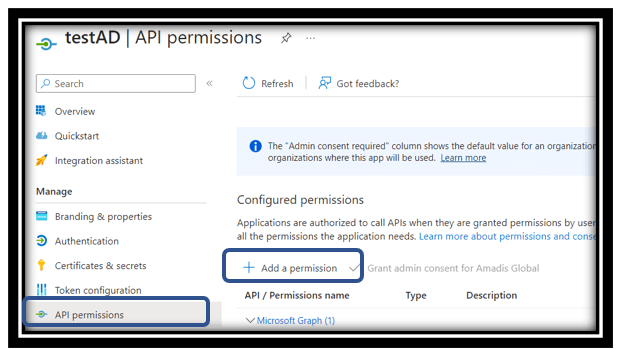
Fig 6: API permissions
Step 1.2: API Permissions
From the Managed Section, Select the API Permission and Click on ‘Add a permission’.
In the “API Permission” Page Click on “Add a Permission”.
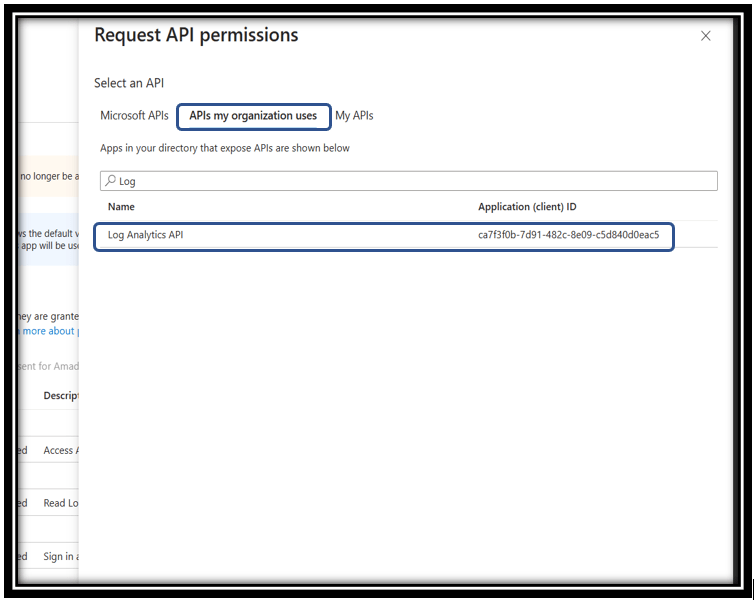
Figure 7: Request API Permission
Step 1.2.1: App Service Authentication
Select “APIs my organization uses” in the Request API Permissions
Search for Log Analytics API and select it.
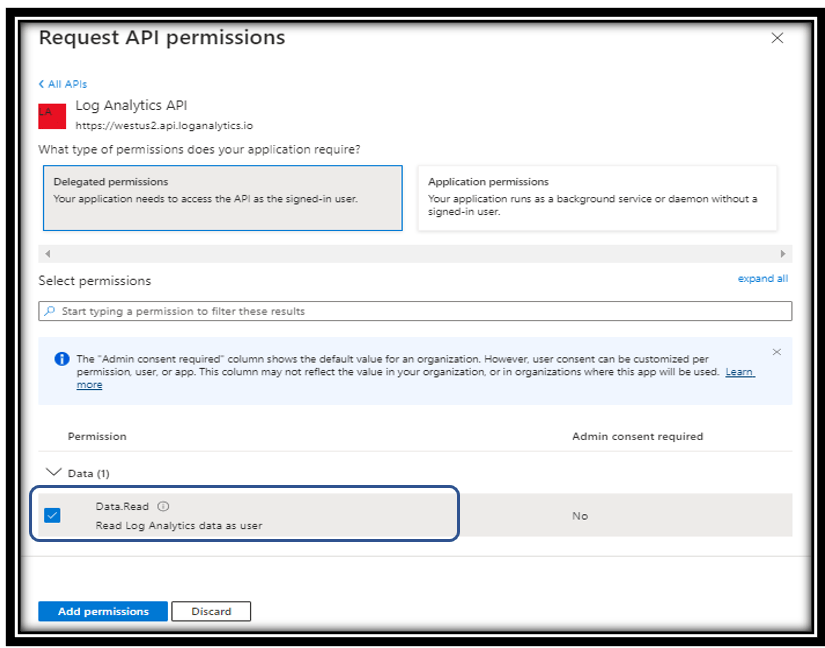
Figure 8: Add Permission
Step 1.2.2: Configure Platforms
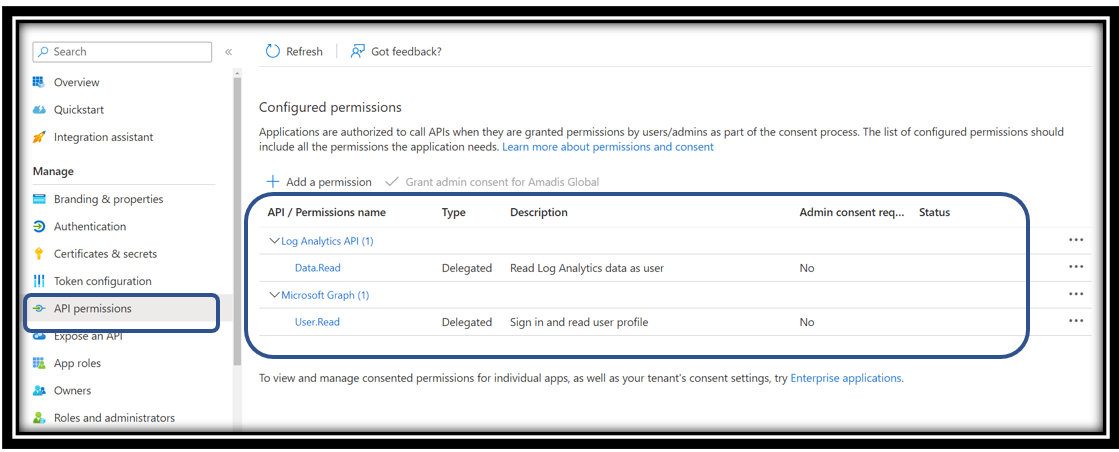
Choose “Delegated Permissions”.
Enable ‘Data.Read’ in the Data Section and then click “Add Permission” Button.
You will see the List of Permissions as shown in the below Figure 12.
Figure 9: Access Control (IAM)
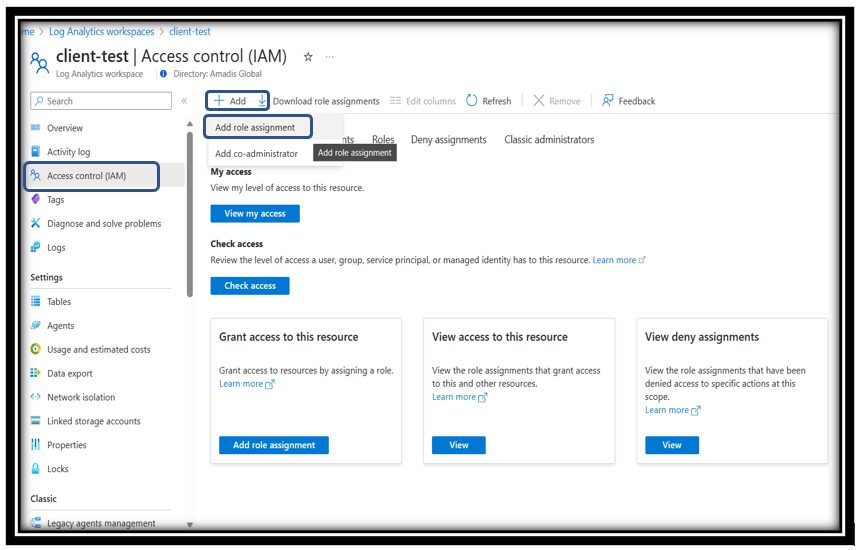
Step 1.2.3: Access Control (IAM)
This is used to read IP Address for providing unused IP Address Recommendation
Open “Subscription” from the azure portal
Select the Access Control (IAM) from the left side panel (Figure: 9).
Click on “+Add” at the top
Select “Add Role Assignment”.
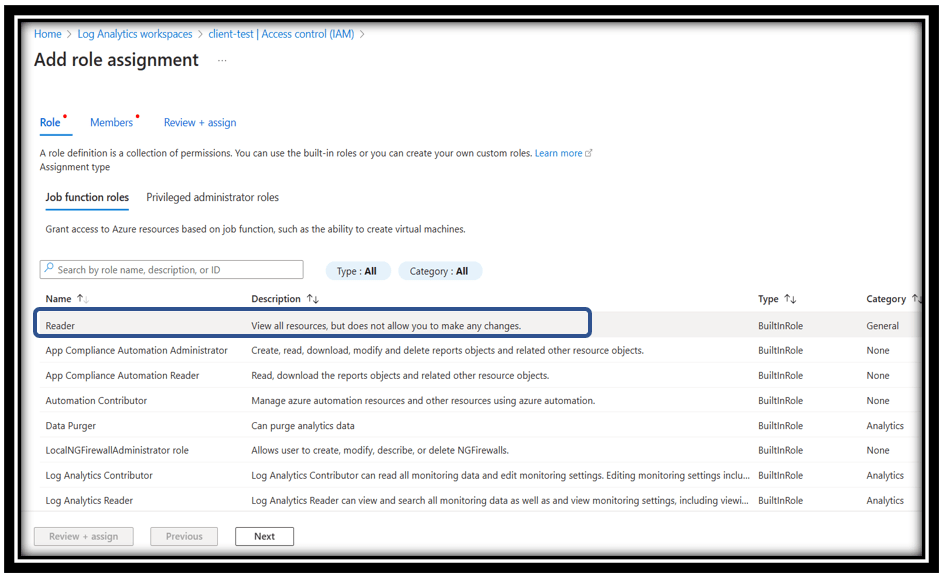
Figure 10: Selecting Reader Role
Step 1.2.4: Reader Role
Search for “Reader” and select “Reader” (Figure: 10).
Click on “Next” button.
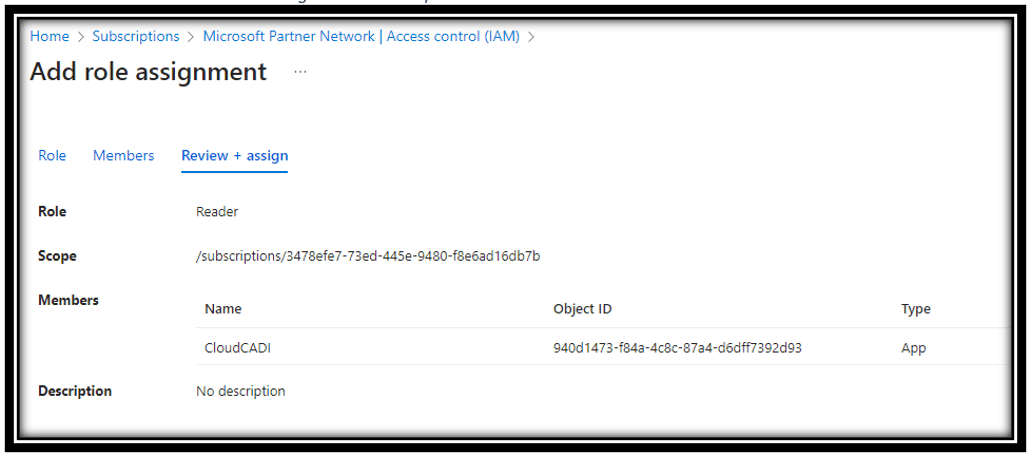
Select Assign access to as “User, group, or service principal”.
Open the already existing Log analytics from azure portal.
Click on the under the “classic” on the left navigation bar.
Note: Step 2.1 and 2.2 should be followed for the use of the existing Log Analytics workspace.
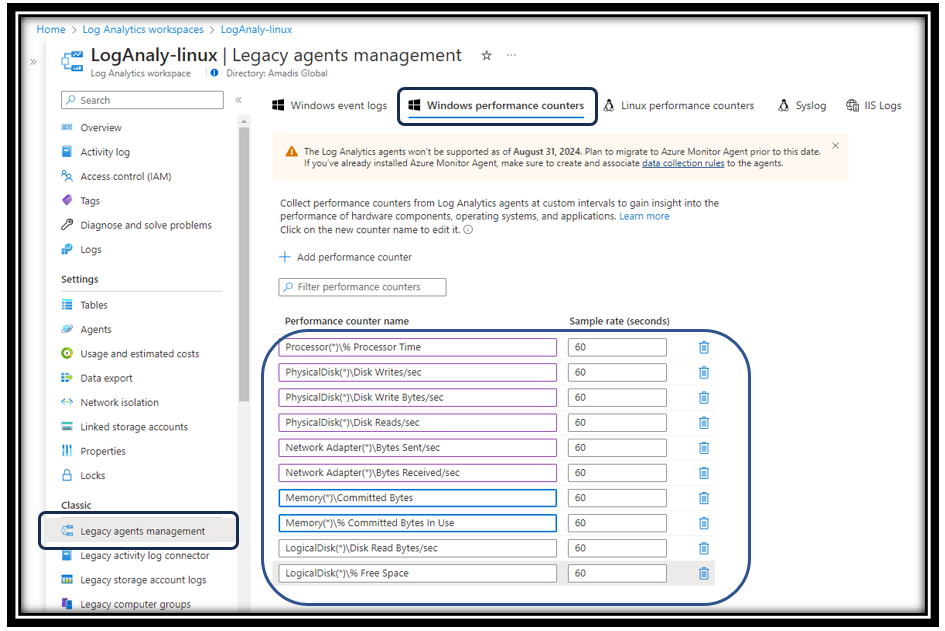
Step 2.1: Windows Performance Counter
Click on Windows performance counters (Figure 12).
Click on the “Add performance counter” button.
Configure the counter with the settings as shown in figure.
Set the Sample rate to 60 seconds.
Figure 13: Windows Performance Counters
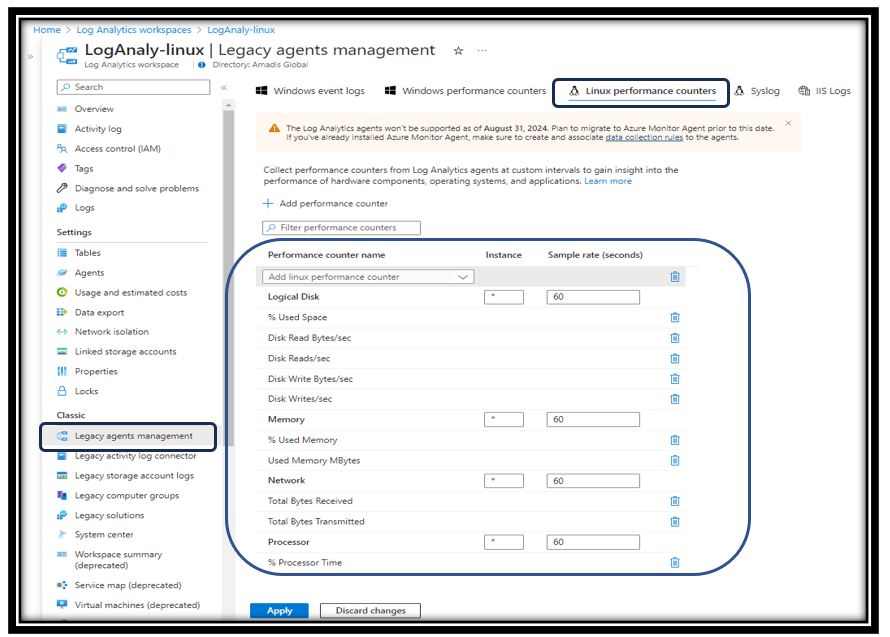
Step 2.2: Linux Performance Counter
Click on the Linux performance counters (Figure 13).
Click on the “Add performance counter” button.
Configure the counter with the settings as shown in figure.
Set the Sample rate to 60 seconds.
Note: Make use of search bar to select the above configuration.
Figure 14: Linux Performance Counters
Step 2.3: Connecting VMs to Workspace
The next step is to connect the VMs to the newly created workspace. This can be done in two ways either using a script or manually from the portal.
Step 2.3.1: From Azure Portal
Go to the created workspace. Scroll down to “Workspace Data Sources” then select “Virtual Machines”. This will take you to the page where all the VMs are listed. You can drill down the VMs based on Resource Group, Location, Subscription, Etc. Click on the desired VM. On the following page, if you see the VM already connected to any workspace (even the default one), it can be disconnected and connected to the current workspace. Alternatively, you can assign the Reader Role to the service principal on those workspaces, enabling it to read log data. (Section: 1.2.2)
Step 2.4: Connecting App Service to Workspace
The next step is to connect the app service to the newly created workspace which can be done manually in the portal.
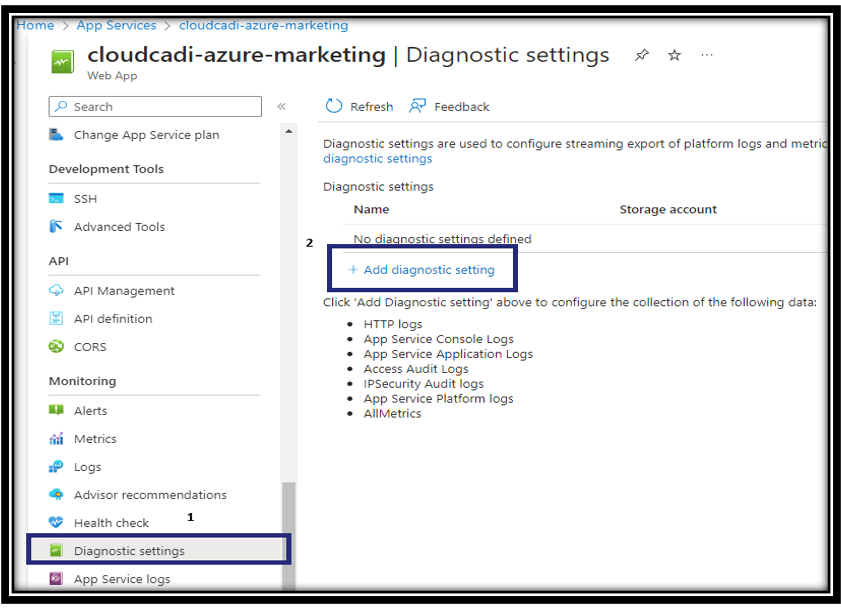
Figure 15: Diagnostic Setting
Step 2.4.1: From Azure Portal
In Azure portal, navigate to App service. Under monitoring (Figure 15), choose the Diagnostic Setting and click “Add diagnostic setting”.
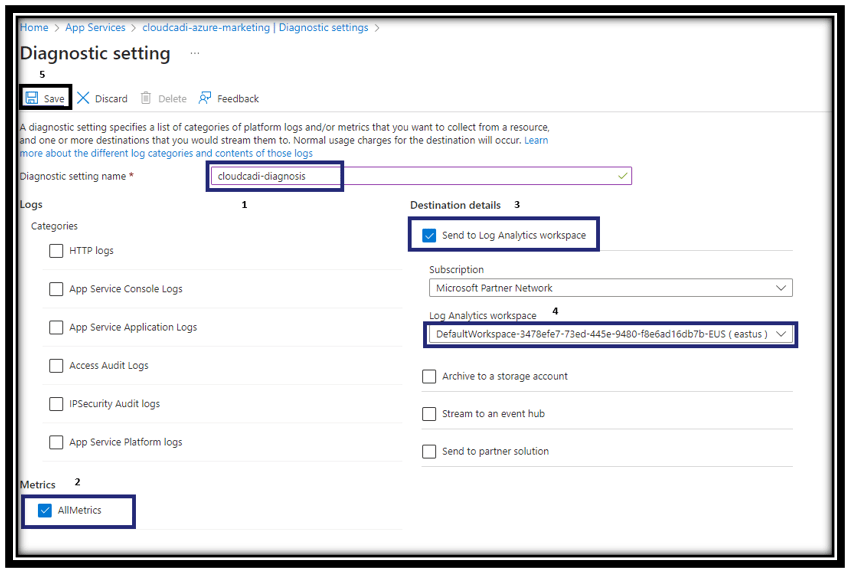
Figure 16: App Service Diagnostic Setting
App Service Diagnostic Setting
Provide (Figure 16) the diagnostic setting name, enable all the metrics needed and choose the destination to send to Log analytics workspace, then select the previously configured Log analytics workspace from the list of available workspaces. Click Save to connect app service to the log analytics workspace.
Step 2.5: Connecting the SQL Database to the workspace
Open the already existing Log analytics from azure portal.
Click on the under the “classic” on the left navigation bar.
Note: Step 2.1 and 2.2 should be followed for the use of the existing Log Analytics workspace.
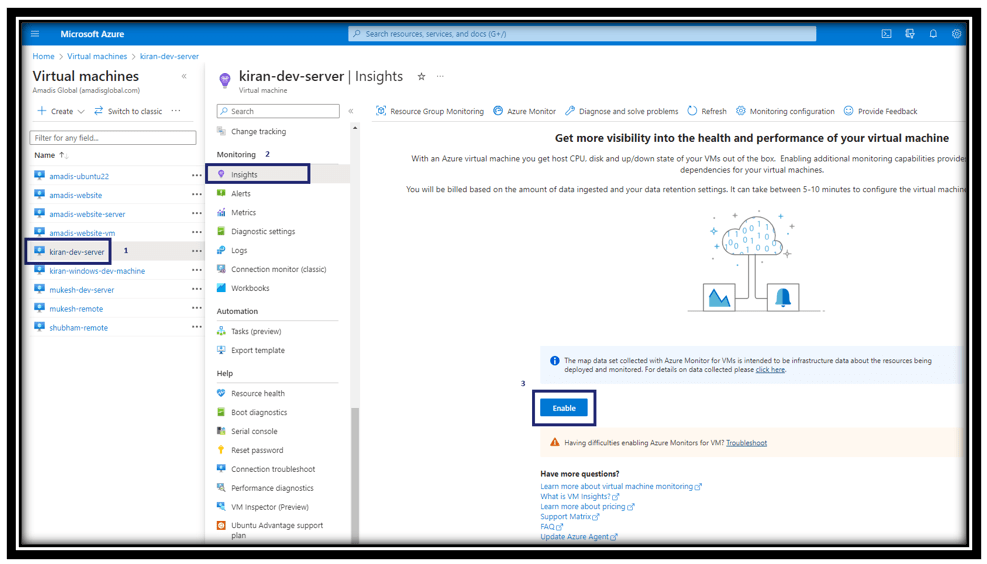
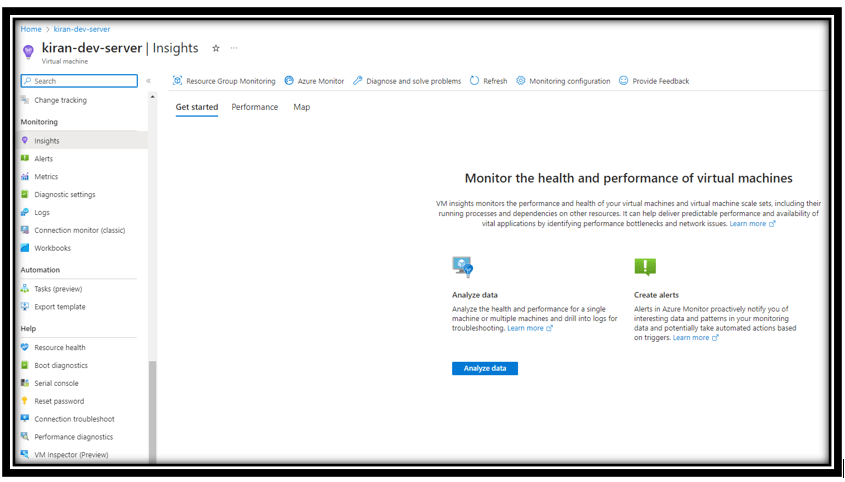
Figure 18: Virtual Machines - Insights
Step 3: Create Data Rules
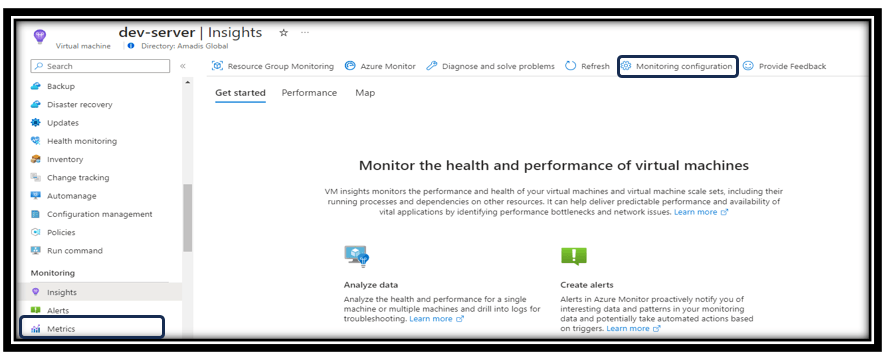
In Azure portal, navigate to Virtual Machines. Choose (Figure 18) the virtual machine which needs to be monitored, click “Insights” then click “enable” to get the VM and performance resource data.
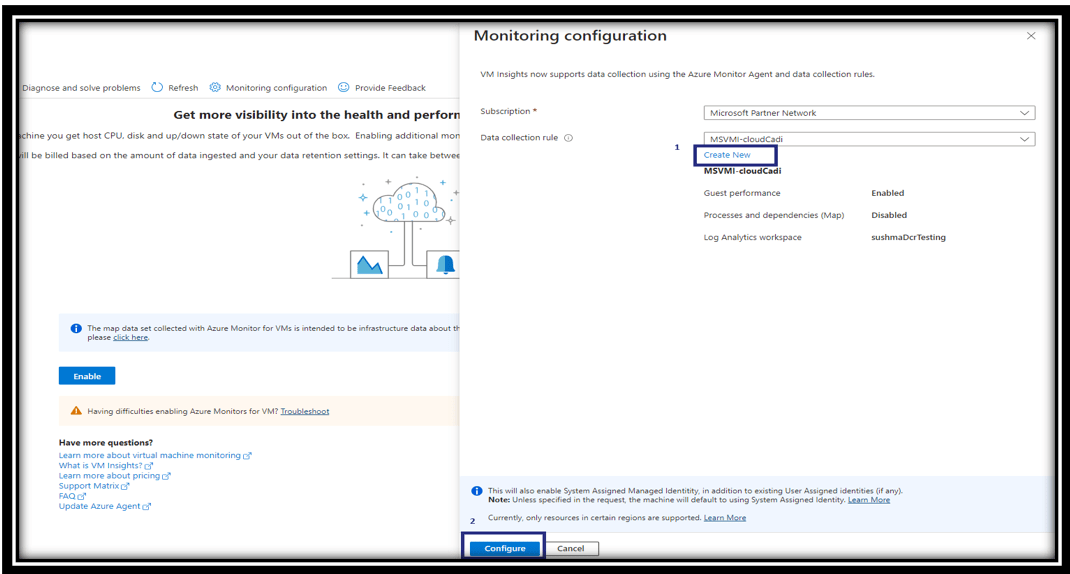
Figure 19: Monitoring Configuration
Monitoring Configuration
In the monitoring configuration (Figure 19), to configure VM insights, click “Create New” if need to use a new DCR or choose previously configured DCR from the list of available DCR, then click “Configure”.
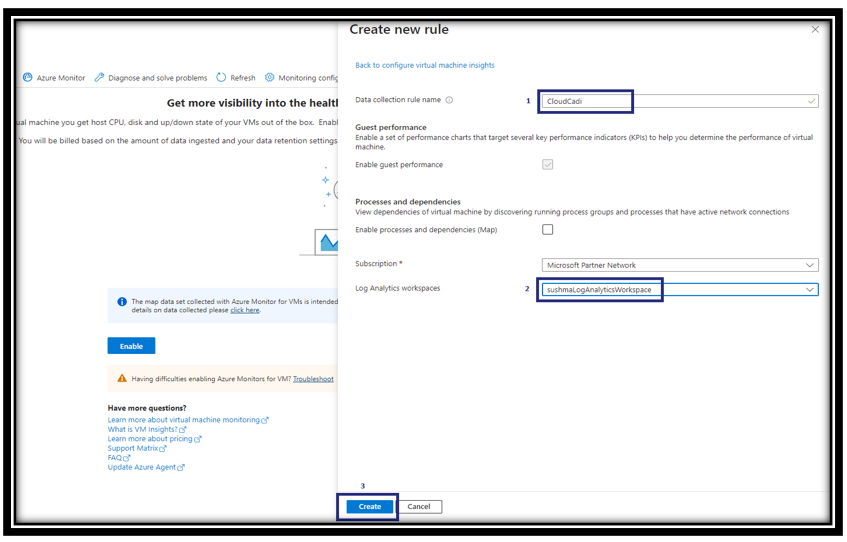
Figure 20: Monitoring Configuration - Create new DCR
Create New DCR
In the Create new rule section (Figure 20), give the data collection rule name, select the previously configured Log analytics workspace from the list of available workspaces then click “Create”.
Note: Same log analytics workspace can be reused again across DCR.
DCR will be created in the same location as the selected Log Analytics workspace.
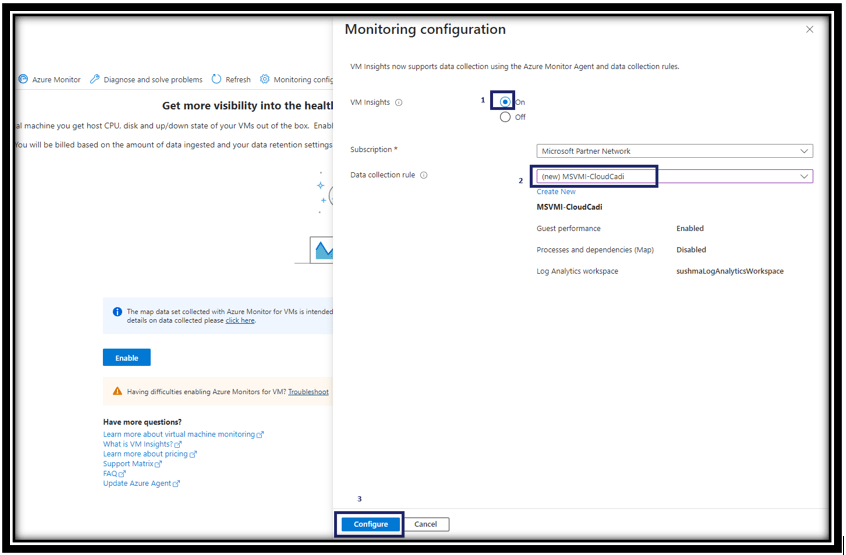
Figure 21: Monitoring Configuration
Monitoring Configuration
In the monitoring configuration (Figure 19), to configure VM insights, click “Create New” if need to use a new DCR or choose previously configured DCR from the list of available DCR, then click “Configure”.
Insights Overview
After enabling the VM insights, insights will be shown as (Figure 22).
Figure 22: Virtual Machine
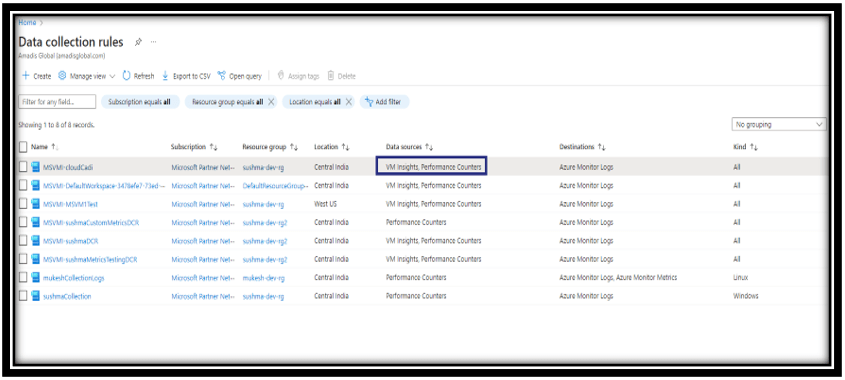
Figure 23: Data Collection Rules
Step 3.1: Add more resource to DCR
In azure portal navigate to Data collection rules, in that can see the created DCR with enabled VM insights and performance counters (Figure 23).
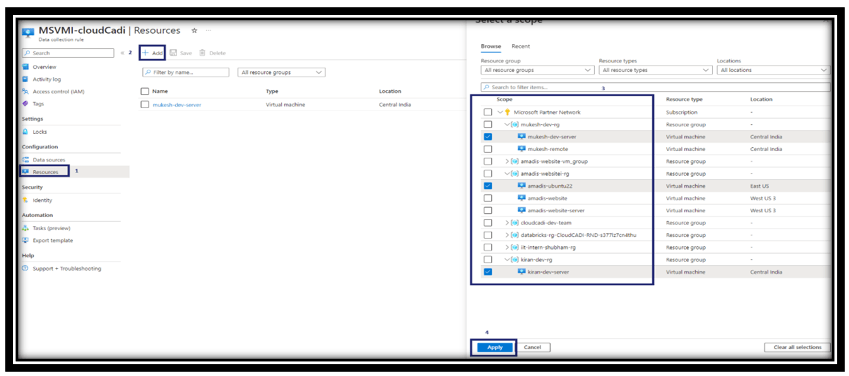
Figure 24: DCR - Select a scope
Monitoring Configuration
To add extra VM in DCR (Figure 24), choose the DCR to include resources, click “+ Add”, in the “Select a scope” section choose the resources need to add, then click “Apply”.
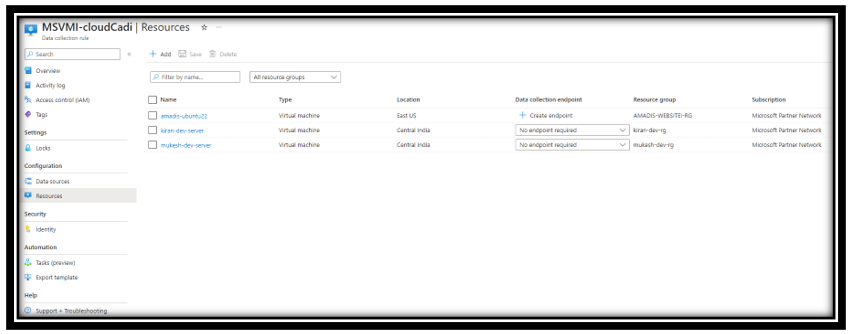
Figure 25: Resources
Resources
After adding the resource, it will be shown in the resource list (Figure 25). Logs of these resources will be sent to the selected log analytics workspace.
Figure 26: Creating DCR in already existing VM insights.
Monitoring Configuration
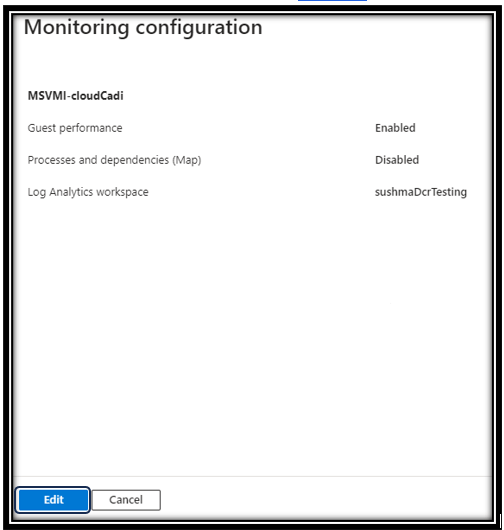
In Azure portal, navigate to Virtual Machines. Choose the virtual machine which needs to be monitored, click “Insights” then click “Monitoring configuration” to get the performance resource data.
Monitoring Configuration
Click on edit to change the existing configuration.
Follow the remaining steps from Figure:19 up to Figure:25.
Figure 27: Editing existing configuration
Add more Log Analytics Workspace to DCR
In Azure portal, navigate to Data Collection Rules (DCR). Choose the DCR which needs to add new log analytics workspace.
Click on the Data source and click the Performance Counters. Click on the Destination. Click on +Add destination.
Choose the Destination type as Azure Monitor Logs and choose the required subscription and choose the required log analytics workspace.
Click on Save.
Figure 28: Adding more Log analytics workspace in a DCR
Step 4: CloudCADI Onboarding
Onboarding Process helps to connect your azure account with the CloudCADI The steps are as follows.
Visit the App Service URL which you created using the managed app.
Sign In with the organization account.
Step 3.1: Onboarding Steps Microsoft Customer Agreement user (MCA)
This section gives information on how to onboard your MCA Account to CloudCADI. Onboarding helps the CloudCADI application to get your cost and performance data to show it in the product dashboard.
Step 3.1.1: MCA Prerequisites for Cost Export
This section gives details on how to export the cost data into the storage account in the azure portal. Also, it describes how to get the connection string, container name from the storage account and log analytics credentials from the azure portal.
Step 3.1.1.1: Cost Export
Login to your Azure Portal.
Go to “Cost Management”.
Search for “Cost Export” in the search bar.
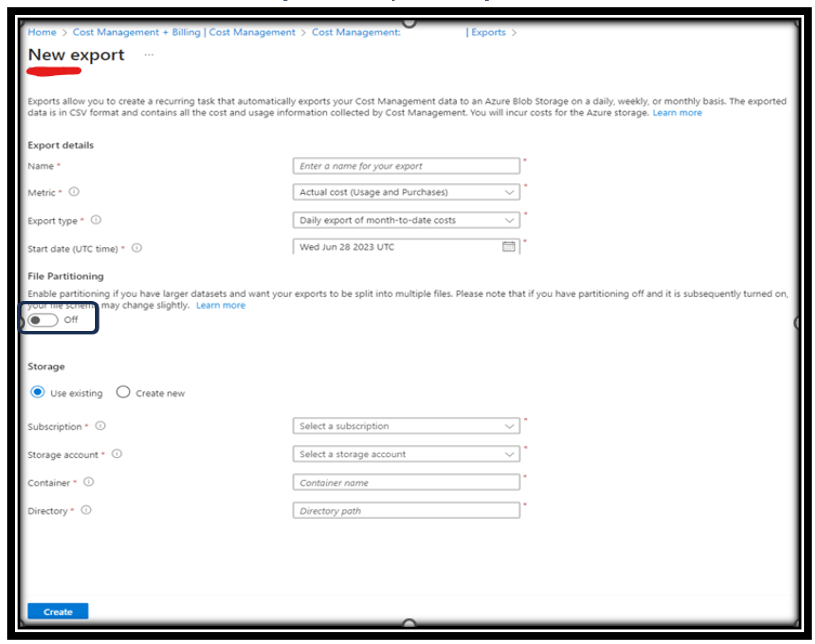
Click on “+Add” and provide the details for the diagram below.
Enter the ‘Name’ as “cloudcadi-exportcost”.
Enter the ‘Metric’ as “Actual Cost”.
Enter the ‘Export Type’ as Daily export of month to date costs.
Mention the preferred start date.
Please make sure that the ‘toggle’ is enabled as shown in Fig 15
Choose the ‘storage account’ which gets created during the managed app creation.
Enter the ‘container name’ as “daily-cost-export”.
Enter the ‘directory name’ as “cloudcadi-dir”
Figure 29: Microsoft Customer Agreement
Step 3.1.1.4: For Getting Credentials From Active Directory
Login to your Azure Portal.
Open the Azure Active Directory and click on the App registration.
Open the Service principal which you created or selected during Managed App Creation.
Under overview Tab, Copy the Application(client) ID and the Directory (tenant) ID.
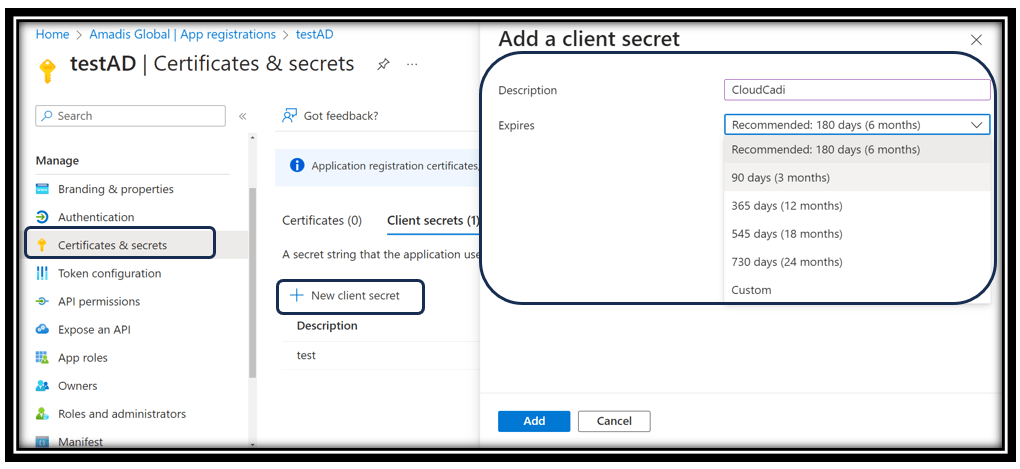
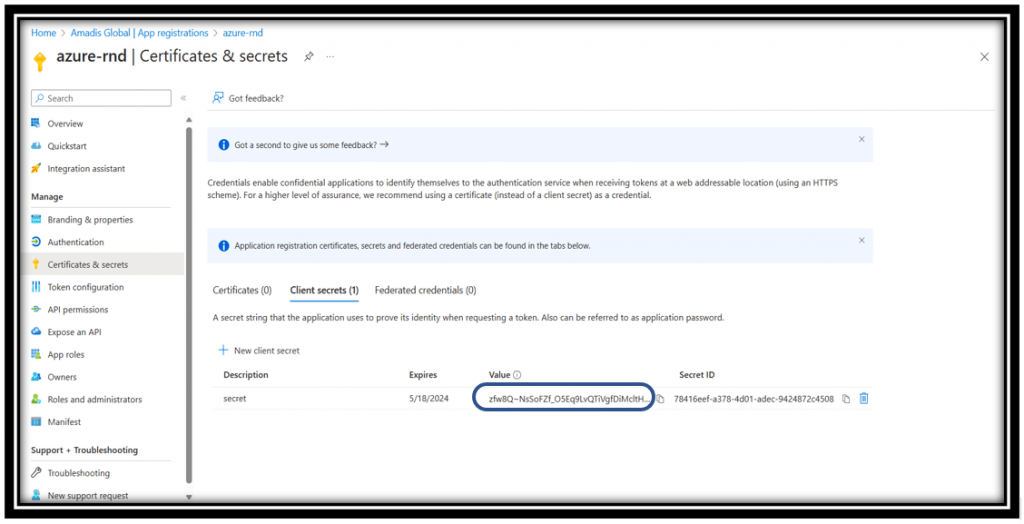
In the Left Panel, go to “Certificates & secrets” and Select the Client secrets in the Right Panel. Select the secret key which you create during the managed app Deployment.
Note: Client secret values cannot be viewed, if you have saved it during the app creation use from that or please create a new client secret.
Step 3.1.1.5: For Getting Workspace ID From Log Analytics
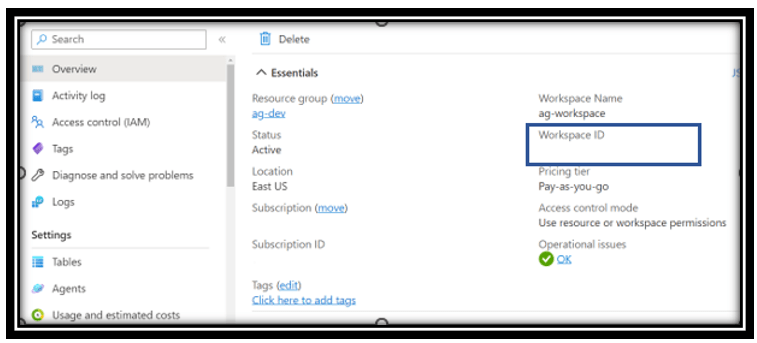
Open the Log Analytics which we created during the managed app creation.
In the Overview, copy the workspace Id.
Figure 32: Log Analytics Workspace ID
Step 3.1.2: Steps For Onboarding
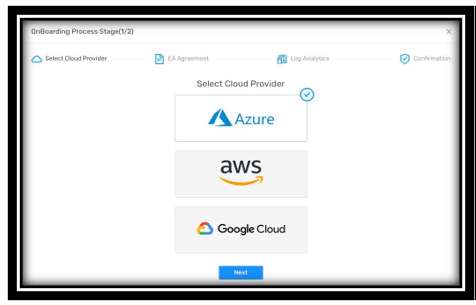
Figure 33: Select Cloud Account Provider
Account Provider
Open the browser and place the CloudCADI App URL.
Select the Cloud Provider as “Azure”.
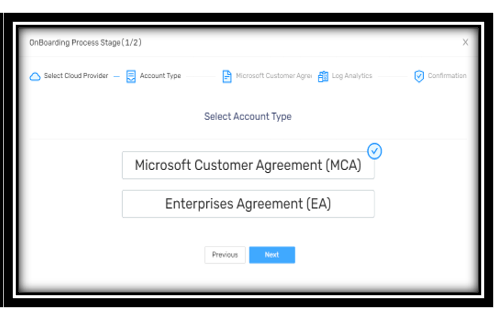
Figure 34: Select Account Type
Account Type
Select the Account Type as “Microsoft Customer Agreement (MCA)”.
Click Next Button to go to Microsoft Customer Agreement screen (Figure: 20)
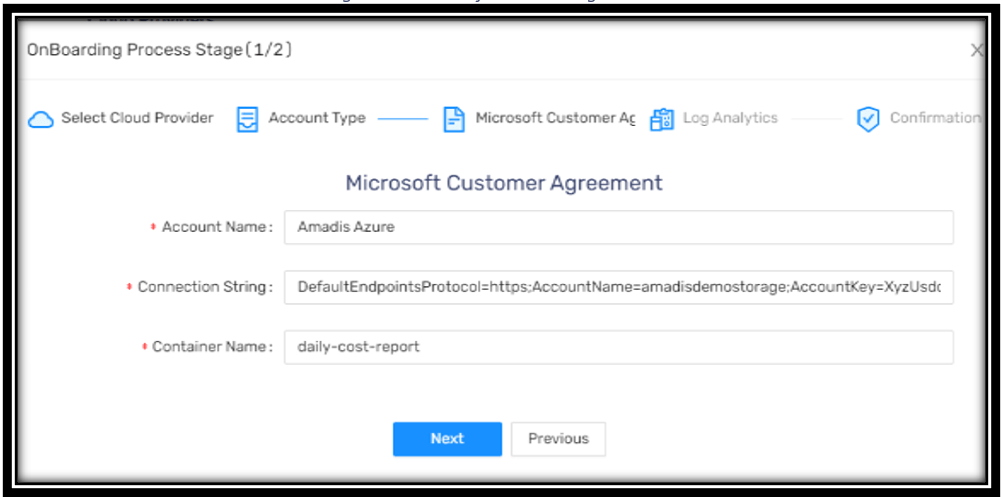
Figure 35: Microsoft Customer Agreement
Microsoft Customer Agreement
Refer 3.1.1.2 and 3.1.1.3 to get the ‘Container Name’ and ‘Connection string’ from the Azure Portal.
After getting the details from the Azure portal, Fill the ‘Container Name’ and ‘Connection String’ in the MCA screen. (Refer Figure: 20) and Click Next.
OnBoarding Process Stage (1/2) Screen will appear.
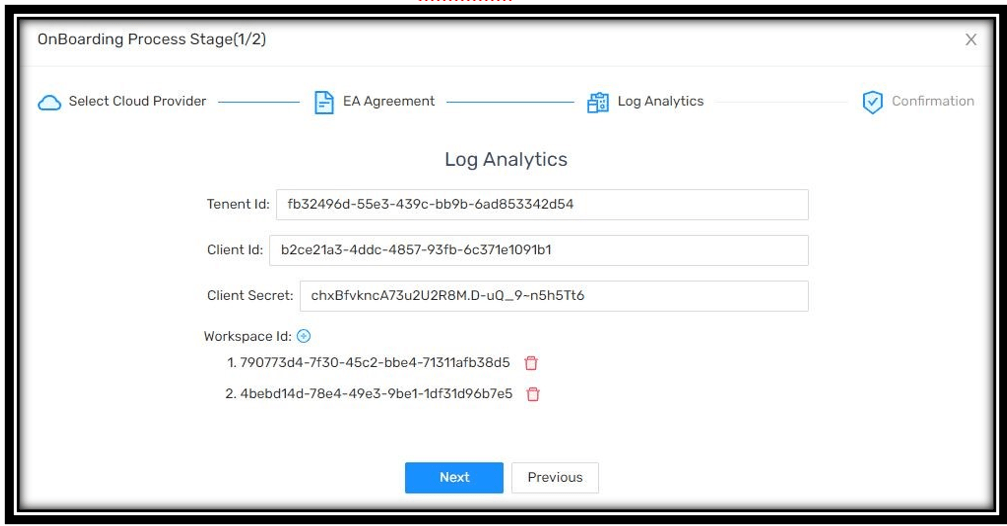
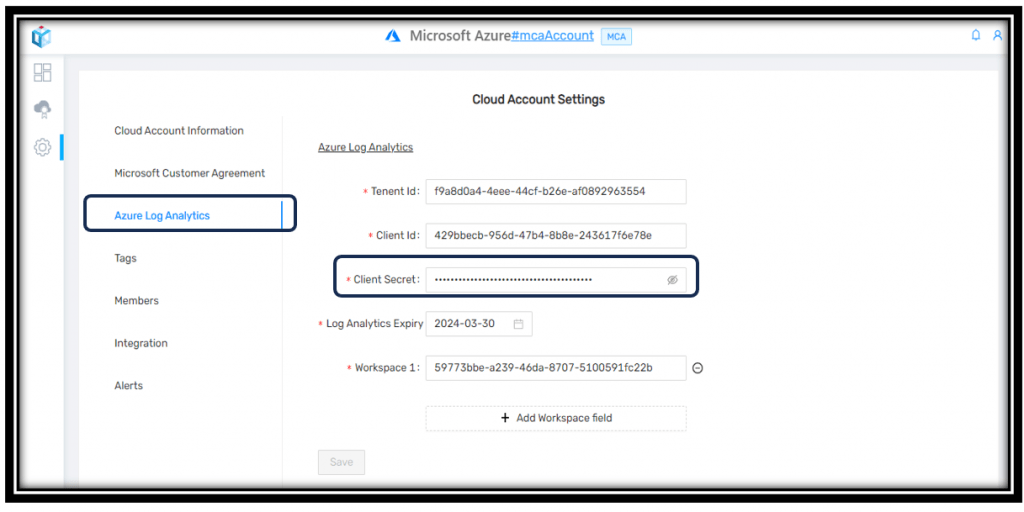
Follow the below steps for getting Tenant Id, Client Id, Client Secret from Active Directory (Refer 3.1.1.4) and Workspace Id from Log Analytics from the Azure Portal (Refer 3.1.1.5)
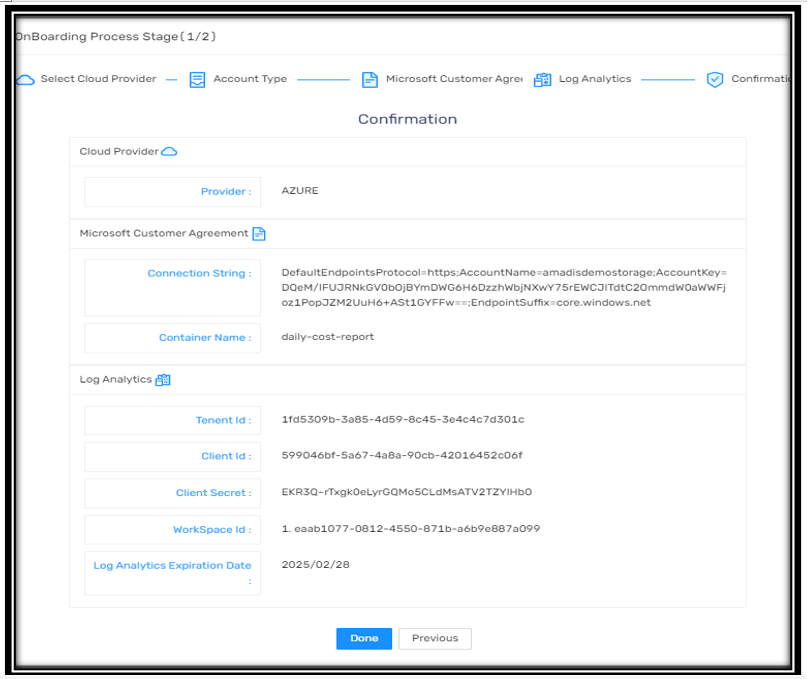
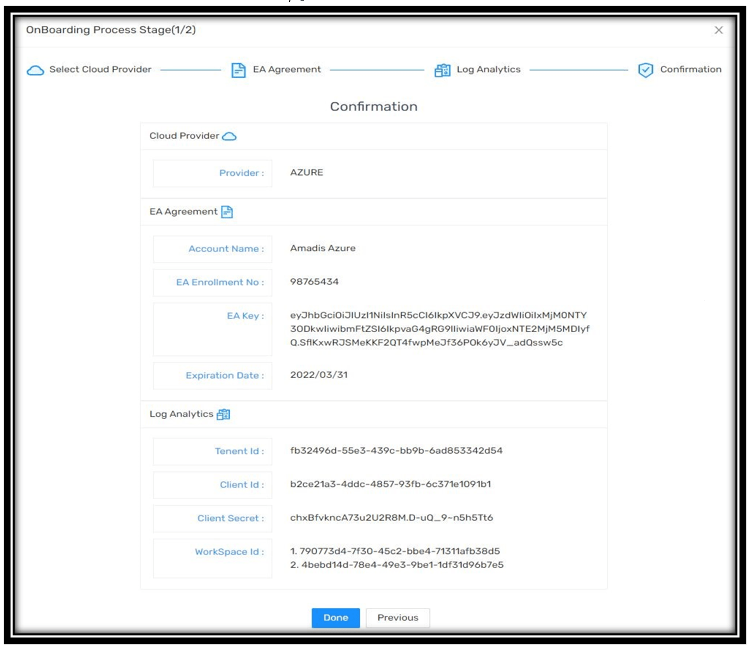
Figure 36: Onboarding Process Stage (1/2)
Onboarding Process Stage
After getting the credentials from the Azure portal, fill the details in the OnBoarding Process Stage (1/2) (Refer Figure:28) and Click Next.
After getting the credentials from the Azure portal, fill the details in the OnBoarding Process Stage 2 (Refer Figure:25) and Click Next.
You will see the Final View of the CloudCADI Screen with the provided credentials (Figure 26).
Click on the Done button to finish the Onboarding Process.
Credentials Overview
Open the Log Analytics which we created during the managed app creation.
In the Overview, copy the workspace Id.
Figure 37: Credentials Overview
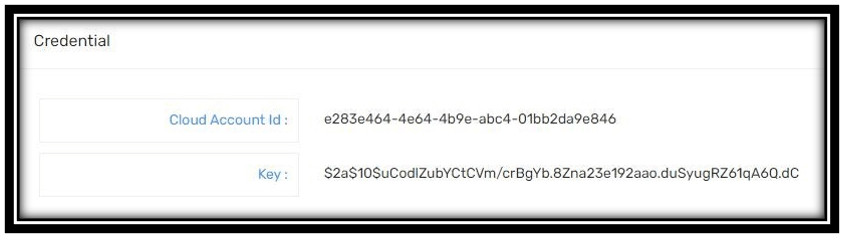
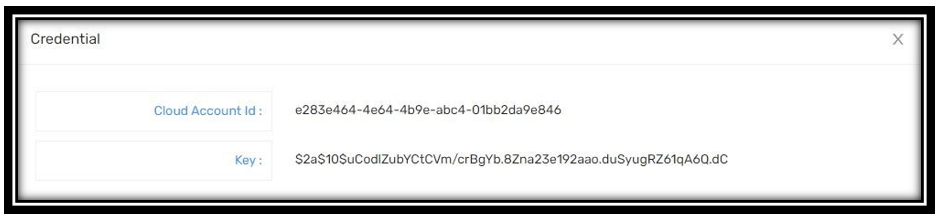
Credentials
Note: Make a note of the Cloud Account Id and Key which will be useful during the Function App configuration (Refer Figure:24).
Figure 38: Credentials
Step 3.2: Onboarding Steps - Enterprise Agreement User
This section gives details on how to onboard your EA Account to CloudCADI. Onboarding helps the CloudCADI application to get your cost and performance data to show it in the product dashboard.
Step 3.2.1: EA Cost Prerequisites
This section gives details on how to get the cost data from the EA Portal. Also, it describes how to get the log analytics credentials from the portal.
Step 3.2.1.1: Enrolment Number & Key
Follow this documentation for getting the “Enrollment no” and “Key”.
Step 3.2.1.2: For Getting Credentials From Active Directory
Login to your Azure Portal.
Open the Azure Active Directory and click on the App registration.
Open the Service Principal which you created or selected during Managed App Creation.
Under overview Tab, Copy the Application(client) ID and the Directory (tenant) ID.
In the Left Panel, go to “Certificates & secrets” and Select the Client secrets in the Right Panel. Select the secret key which you create during the managed app Deployment.
Note: Client secret values cannot be viewed, if you have saved it during the app creation use from that or please create a new client secret.
Step 3.2.1.2: Get Workspace ID
Open the Log Analytics which we created during the managed app creation.
In the Overview, copy the workspace Id (Figure: 22)
Step 3.2.2: Steps For Onboarding
Figure 39: Select Cloud Provider
Account Provider
Open the browser and place the CloudCADI App URL.
Select the Cloud Provider as “Azure”.
Figure 40: Select Account Type
Account Type
Select the Account Type as “Enterprises Agreement (EA)” (Figure: 26).
Click Next Button to go to Enterprises Agreement screen (Figure: 27)
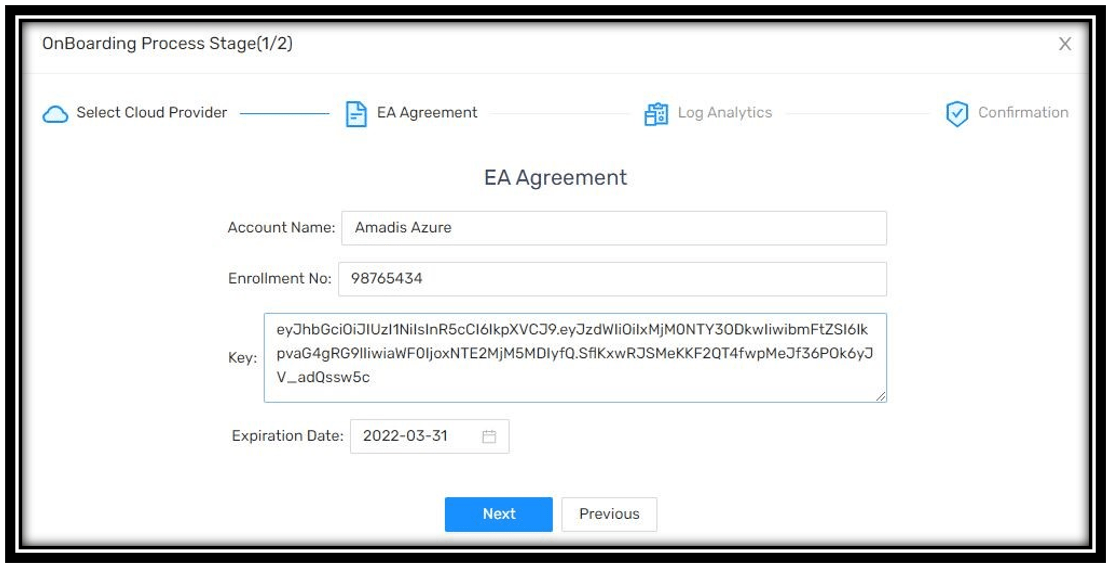
Figure 41: EA Agreement credentials
EA Agreement
Follow the EA-Prerequisite document link for getting “Enrollment No” and “Key” from EA Portal. (Refer 3.2.1.1)
Enter the details and Click Next (Figure: 27).
Below mentioned OnBoarding Process Stage (1/2) Screen will appear.
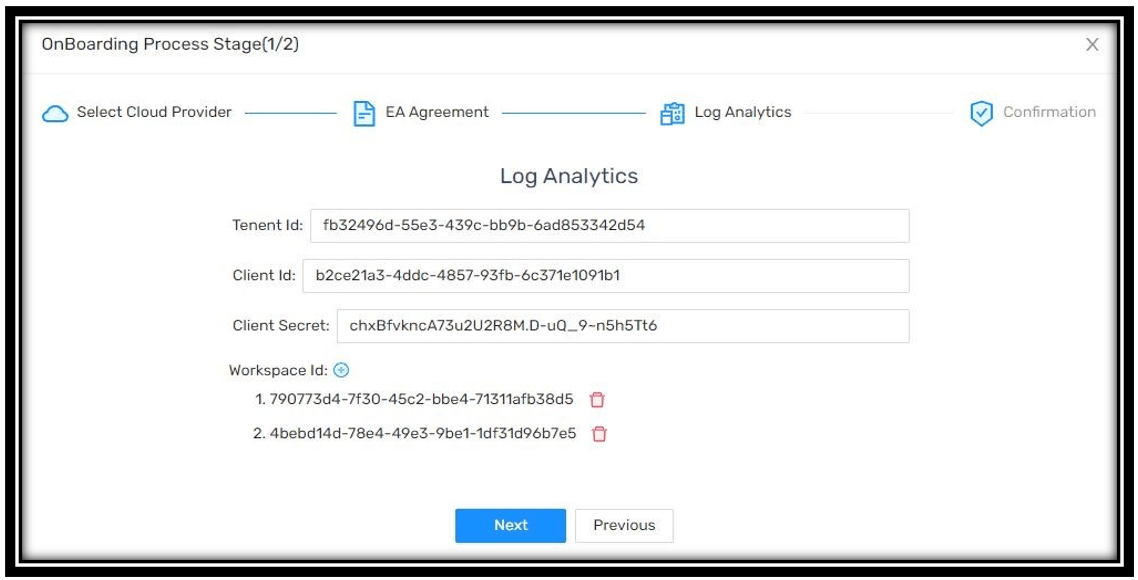
Figure 42: OnBoarding Process Stage (1/2)
Onboarding Process Stage
Follow the below steps for getting Tenant Id, Client Id, Client Secret from Active Directory (Refer 3.2.1.2 and Workspace Id from Log Analytics from the Azure Portal (Refer 3.2.1.3)
After getting the credentials from the Azure portal, fill the details in the OnBoarding Process Stage (1/2) (Refer Figure:28) and Click Next.
Credentials Overview
You will see the Final View of the CloudCADI Screen with the provided credentials (Refer Figure:29).
Click the Done button to finish the Onboarding Process.
Figure 43: Final Overview
Credentials
Note: Make a note of the Cloud Account Id and Key which will be useful during the Function App configuration (Refer Figure:30).
Figure 44: Credential
Step 4: Environmental Setup for Function App
Function App is used to make time trigger that fetches the data from the azure portal and insert into the CloudCADI application using the ‘Cloud Account Id’ and ’Key’ which we created during the CloudCADI Onboarding Step. (Step 3)
Steps for Function App Setup
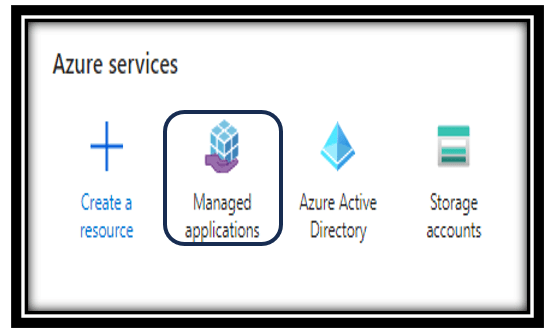
Open the Function App which gets created during the managed app creation.
Settings Section
Click on the Configuration tab which is under the settings section
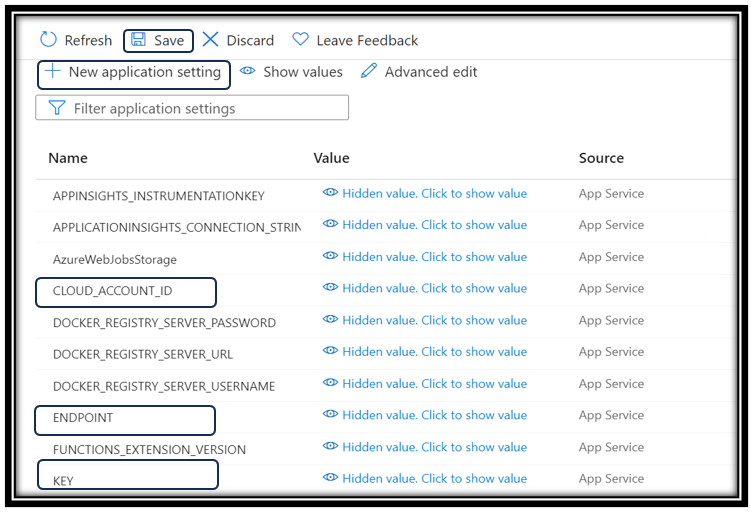
Under the Application Settings, click on the “New application setting” and add the details below.
Name= ENDPOINT / Value= “https://<App service URL>”
Name= CLOUD_ACCOUNT_ID / Value= “Your cloud account Id from onboarding process”
Name= KEY / Value= “Your KEY from onboarding process”
Name=FILE_PARTITION/ Value= ”true”
Click on ‘Save’ on the top to save the configuration.
Figure 45: Application Settings
Step 5: Appendices
Below section are used after product Onboarding, during post installation.
We use cookies and similar technologies on our website and process your personal data (e.g. IP address), for example, to personalize content and ads, to integrate media from third-party providers or to analyze traffic on our website. Data processing may also happen as a result of cookies being set. We share this data with third parties that we name in the privacy settings.
The data processing may take place with your consent or on the basis of a legitimate interest, which you can object to in the privacy settings. You have the right not to consent and to change or revoke your consent at a later time. For more information on the use of your data, please visit our privacy policy.
Below you will find an overview of all services used by this website. You can view detailed information about each service and agree to them individually or exercise your right to object.
Essential (1)
Essential services are required for the basic functionality of the website. They only contain technically necessary services. These services cannot be objected to. • Show service information